A1C to blood glucose conversion: chart, formula, and examples
Sheenam Midha · Health writer
On this page
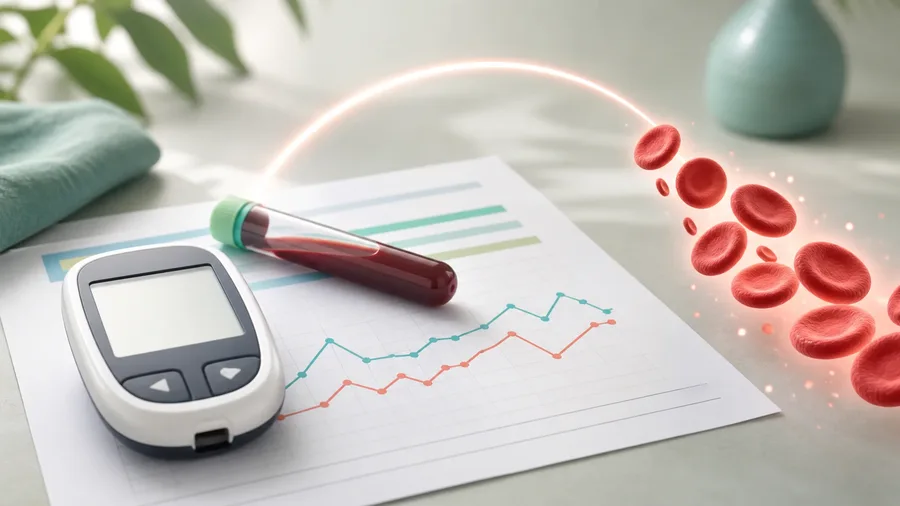
A1C to blood glucose conversion turns a laboratory percentage into estimated average glucose, or eAG, in the same units used by many glucose meters. It is a translation, not a reconstruction of every reading from the previous three months.
Use the A1C calculator for an instant result. The formula is based on the international ADAG study relationship summarized by the NGSP.
Why convert A1C to estimated average glucose?
A result such as 7.0% can feel abstract. An eAG near 154 mg/dL uses the same scale as a meter, making the long-term result easier to discuss. The conversion also helps explain why a normal-looking fasting value does not always mean the full-day average is in range.
Do not compare eAG with one reading. Compare it with a pattern of readings or a sufficiently complete CGM period.
How the A1C to blood glucose conversion works
For milligrams per deciliter:
eAG (mg/dL) = 28.7 × A1C − 46.7
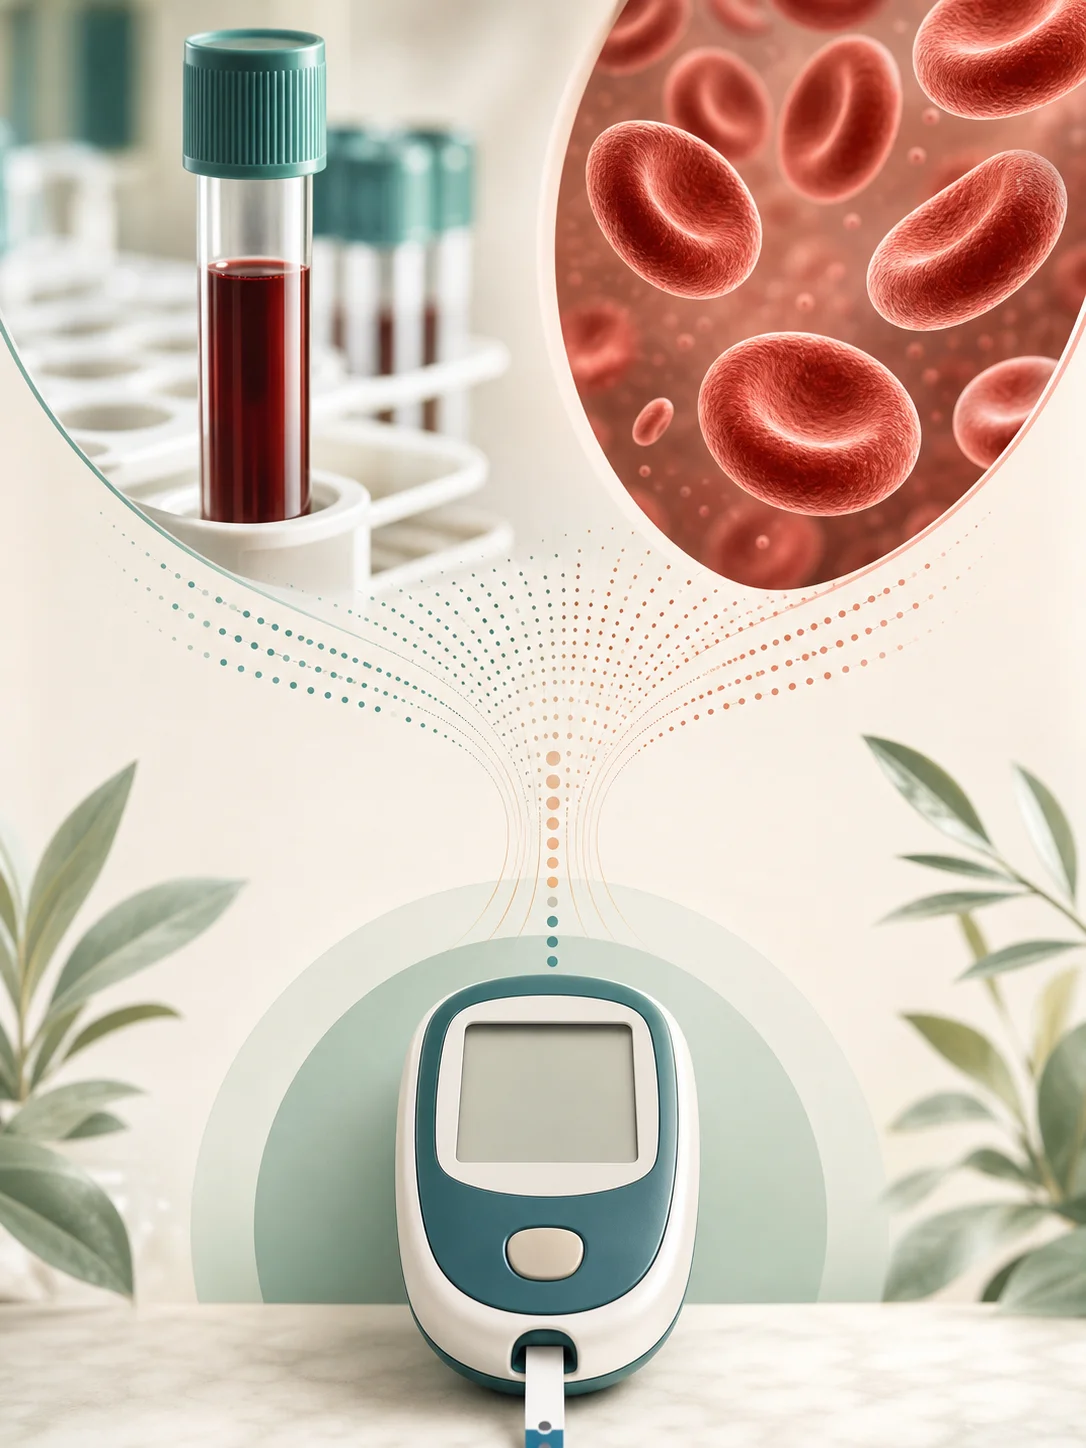
For millimoles per liter:
eAG (mmol/L) = eAG (mg/dL) ÷ 18
Example for A1C 7.0%:
- 28.7 × 7.0 = 200.9
- 200.9 − 46.7 = 154.2 mg/dL
- 154.2 ÷ 18 = 8.6 mmol/L
A1C to blood glucose conversion chart
| A1C | Estimated average glucose | Estimated average glucose |
|---|---|---|
| 5.0% | 97 mg/dL | 5.4 mmol/L |
| 5.5% | 111 mg/dL | 6.2 mmol/L |
| 6.0% | 126 mg/dL | 7.0 mmol/L |
| 6.5% | 140 mg/dL | 7.8 mmol/L |
| 7.0% | 154 mg/dL | 8.6 mmol/L |
| 8.0% | 183 mg/dL | 10.2 mmol/L |
| 9.0% | 212 mg/dL | 11.8 mmol/L |
| 10.0% | 240 mg/dL | 13.3 mmol/L |
| 11.0% | 269 mg/dL | 14.9 mmol/L |
| 12.0% | 298 mg/dL | 16.6 mmol/L |
Values are rounded. They describe the average relationship in the study population, not an exact personal equivalence.
What the percentage is actually averaging
A1C does not take every glucose value from the last three months, add them together, and divide by the number of readings. The lab measures the share of hemoglobin with glucose attached. Because red blood cells circulate for weeks, the result acts as a record of recent glucose exposure.
That record is not spread perfectly evenly across 90 days. Newer glucose levels tend to influence the result more than older ones because blood cells are continually replaced. If you changed treatment two weeks ago, your meter may already look different while the A1C still carries part of the earlier pattern. This is one reason a quick repeat can be hard to interpret.
The percentage also hides variation. Two people can both have an A1C of 7.0% and an eAG near 154 mg/dL, yet live through very different days. One may stay close to the average most of the time. Another may swing between frequent lows and high after-meal peaks. The same average does not mean the same risk or the same treatment decision.
If you use a CGM, time in range, time below range, and the daily trace add context. If you use a meter, a planned mix of fasting, before-meal, after-meal, and symptom-time checks can be more informative than repeating only the easiest time of day.
Three examples that show the formula’s limits
Consider someone whose A1C converts to 140 mg/dL. Their fasting readings are usually near 100 mg/dL, so the estimate may initially seem too high. A few checks one to two hours after meals could reveal readings near 190 mg/dL. The fasting number was real; it simply missed the part of the day contributing most to the average.
Now consider a person whose meter average is 145 mg/dL but whose A1C-derived eAG is closer to 170 mg/dL. They test mainly before breakfast and dinner. Overnight readings and meal peaks are mostly absent, so the meter’s arithmetic average is based on a selective sample. More strategic checks or a short CGM period may explain the gap.
The reverse can happen too. A person starts a new treatment and sees a CGM mean of 125 mg/dL over the latest 14 days, while an A1C drawn that week converts to 160 mg/dL. That does not automatically mean the sensor is wrong. The A1C still reflects the higher glucose exposure that occurred before the change.
These examples are not diagnostic rules. They show why the converted value is a prompt to look at timing, data coverage, and recent changes before assuming one device or test has failed.
How to compare eAG with CGM data
Start by matching the time periods as closely as possible. A 7-day CGM average is not a fair comparison with a laboratory marker that looks back much further. A longer CGM report with good sensor wear gives a better comparison, although it still will not cover exactly the same biology.
Then check whether the sensor report has long data gaps. A missing night, a sensor removed for several days, or frequent compression lows can pull the displayed average away from the true pattern. Review calibration and replacement instructions for your specific device rather than applying advice written for a different model.
Next, look beyond the mean. Repeated low readings can cancel out repeated highs mathematically and leave an average that looks ordinary. Those lows still matter. Do not try to raise or lower the average by changing insulin, food, or medicine on the strength of the conversion alone.
Finally, ask whether red-cell turnover could affect A1C. Recent blood loss, transfusion, iron deficiency, some hemoglobin variants, pregnancy, and kidney disease are among the reasons a clinician may put more weight on glucose data or choose another laboratory marker.
Using the chart after a new laboratory result
Write down the laboratory date, the A1C, the converted eAG, and any major change during the previous three months. Useful notes include a new medicine, a steroid course, an infection, a change in insulin access, pregnancy, blood loss, or several weeks of unusually different eating and activity.
If the test was done for diagnosis and you do not have classic symptoms, one abnormal result usually needs confirmation with an appropriate laboratory test. A home meter is useful for monitoring but is not the instrument used to make the diagnosis. Do not label yourself from a calculator result.
If you already have diabetes, compare the result with the personal goal documented by your care team. A general target from an online chart may be too strict or too relaxed for you. Pregnancy, severe hypoglycemia, frailty, kidney disease, and other health conditions can change what safe control looks like.
One practical way to prepare for the appointment is to bring a short list of questions: Does the A1C fit my home pattern? Am I checking at the times most likely to answer our question? Could any health condition distort the result? What change are we testing before the next lab? That conversation is far more useful than treating eAG as a verdict.
Why eAG may not match your meter or CGM
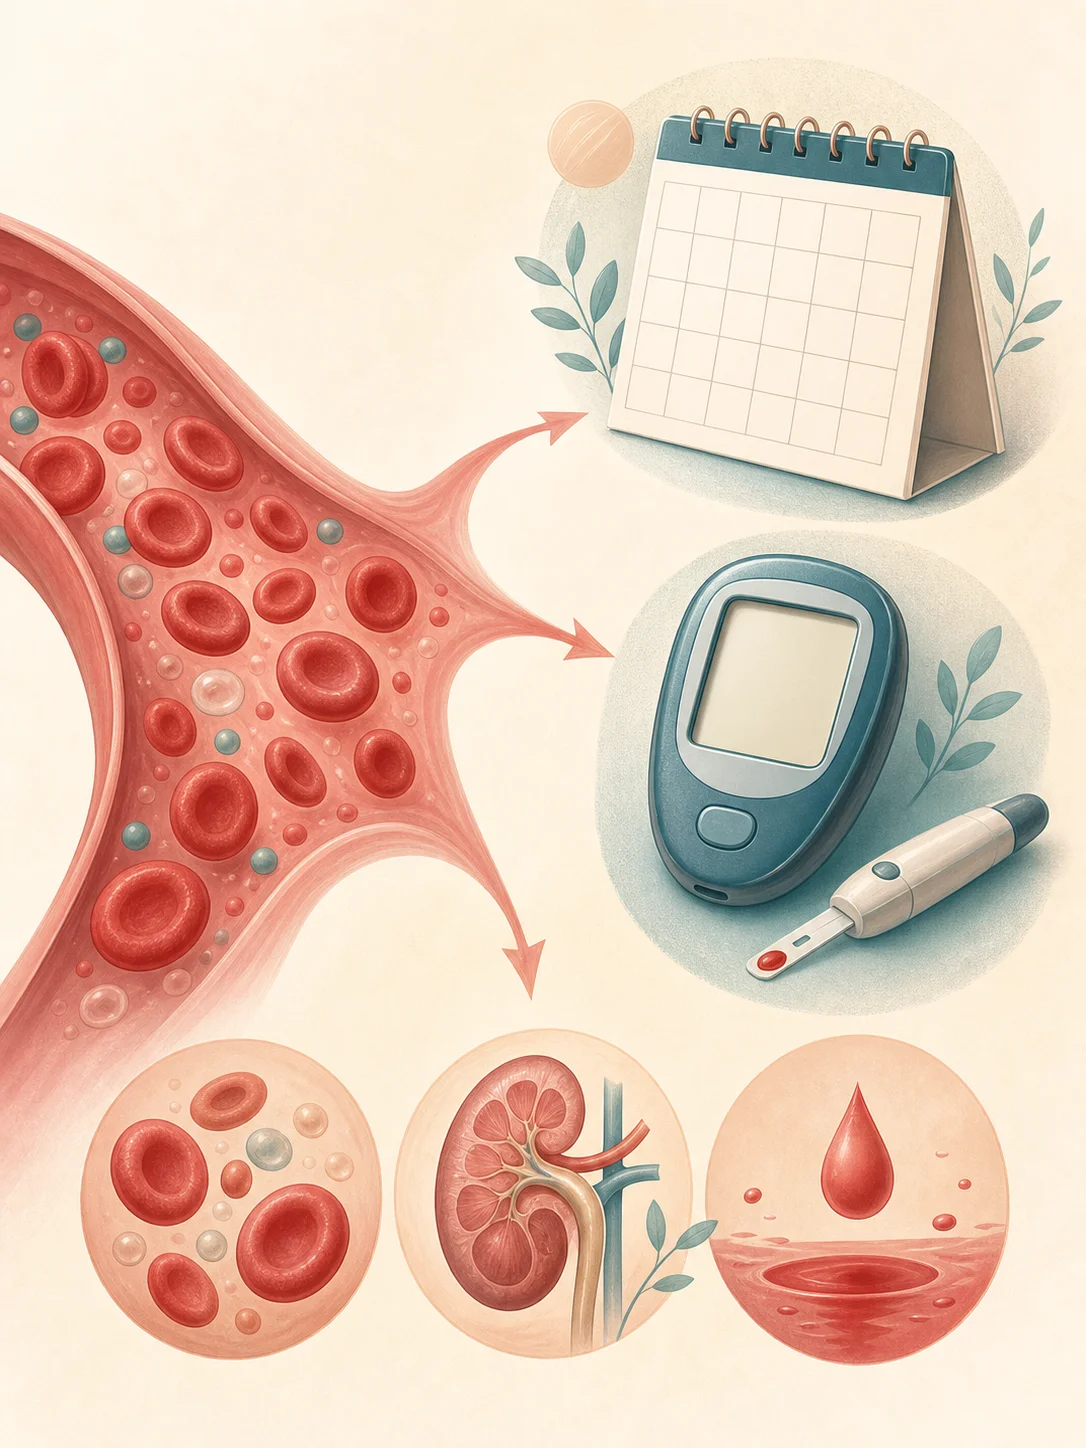
Meters are often used at selected times, such as before breakfast. A1C includes exposure after meals and overnight. CGM captures far more data, but sensor gaps, compression lows, and the period selected can still change its mean.
A1C also depends on red blood cells. Anemia, kidney disease, recent bleeding, transfusion, pregnancy, and some hemoglobin variants can change the result independently of glucose. The NIDDK describes these limitations in detail.
How to use the conversion responsibly
Use eAG to translate a confirmed laboratory result, compare broad trends, and prepare questions for your next visit. Do not use it to calculate an insulin dose or decide that a single high or low reading is harmless.
For diagnostic cutoffs and common monitoring targets, see our blood-sugar chart by age. If the A1C is above your agreed goal, start with safe, evidence-based ways to lower A1C rather than a quick-fix promise.
Keep the original percentage in your records. The conversion is convenient, but clinical guidelines and laboratory reports often discuss A1C directly. Rounding can also make reverse conversion slightly different. For example, an eAG displayed as 154 mg/dL may convert back to a percentage that is close to, but not presented exactly like, the laboratory’s 7.0%.
Use the same certified laboratory when practical, especially when a small trend will influence treatment. Point-of-care A1C devices can be useful for monitoring in appropriate clinical settings, but diagnosis requires a method and setting that meet diagnostic standards. If a new result is sharply different from the home pattern or previous laboratory value, repeat and investigate it instead of changing treatment from the calculator alone.
Use the estimate as context
The conversion makes A1C easier to understand, but the result remains an estimate. Your laboratory A1C, meter or CGM pattern, symptoms, medicines, and medical history belong in the same conversation.
Evidence and review
How this article was checked
Formula and interpretation checked against NGSP, CDC, and NIDDK materials. This article has not been independently medically reviewed. Evidence last reviewed Aug 4, 2026.
- NGSP - HbA1c and Estimated Average Glucose - Standardized relationship and eAG regression formula.
- NIDDK - The A1C Test and Diabetes - A1C interpretation, limitations, and relationship to eAG.
- CDC - A1C Test for Diabetes and Prediabetes - Current diagnostic ranges and example A1C-to-eAG values.
FAQ
Frequently asked
Answers
Frequently asked questions
What is the formula for converting A1C to average glucose?
Estimated average glucose in mg/dL is 28.7 multiplied by A1C, minus 46.7. Divide mg/dL by 18 to estimate mmol/L.
Does eAG equal my fasting glucose?
No. eAG estimates an average across day and night, including after-meal periods. A fasting test is one measurement under specific conditions.
Why is my CGM average different from A1C-derived eAG?
The formula describes an average relationship across study participants. Red-cell lifespan, missing CGM data, sensor differences, recent changes, and medical conditions can create a personal mismatch.
Share this article