Body fat percentage chart for men and women, by age
Sheenam Midha · Health writer
On this page
A body fat percentage chart groups adults into broad descriptive categories. It can help interpret an estimate, but the error of the measurement may be as important as the category boundary.
Use the body-fat calculator to estimate body composition with the U.S. Navy tape method.
Why body fat percentage can add context
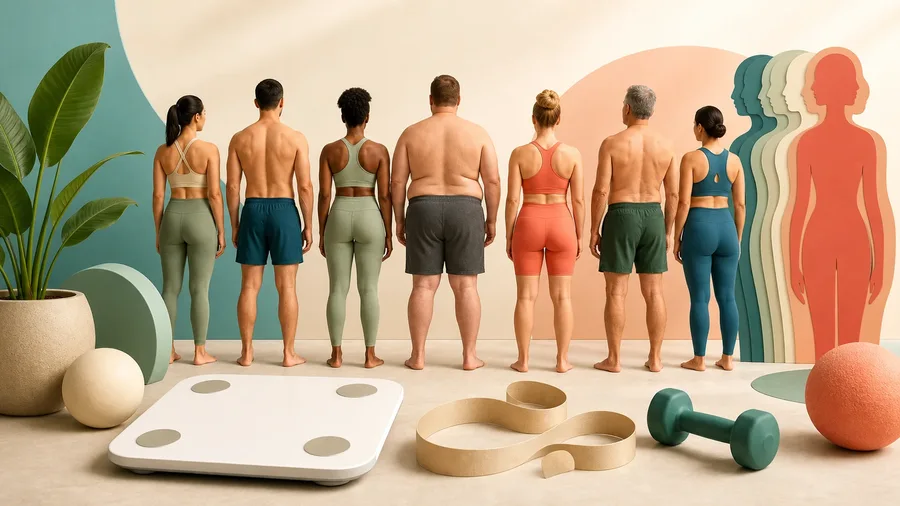
Body weight cannot distinguish fat mass from lean mass. Two people with the same BMI can have different muscle, fat distribution, fitness, and metabolic health. Body-fat percentage adds information, especially when tracked consistently.
It still does not measure where fat is stored, how strong or fit someone is, or whether blood pressure, glucose, and lipids are healthy.
Body fat percentage chart
These commonly used ACE categories are broad descriptors:
| Category | Women | Men |
|---|---|---|
| Essential fat | 10-13% | 2-5% |
| Athletes | 14-20% | 6-13% |
| Fitness | 21-24% | 14-17% |
| General/average | 25-31% | 18-24% |
| Higher range | 32% and above | 25% and above |
“Athlete” is not a requirement for health, and “average” is not a diagnosis. The categories do not adjust for age or individual medical risk.
What counts as fat mass and lean mass?
Body fat percentage is fat mass divided by total body mass, multiplied by 100. A person who weighs 80 kilograms and carries an estimated 20 kilograms of fat has an estimated body fat percentage of 25%.
Everything that is not fat is grouped as fat-free mass. That includes muscle, bone, organs, connective tissue, and body water. “Lean mass” on a consumer report is therefore not the same thing as skeletal muscle. A scale that says lean mass rose overnight is usually detecting a water shift, not new muscle tissue.
Essential fat supports basic physiology. Storage fat is found under the skin and around organs. A chart cannot tell how much fat sits in the abdomen or around organs, which is why waist measurement can add useful information.
The percentage also depends on both sides of the fraction. Someone can lower body fat percentage by losing fat while maintaining lean mass. It may also fall when muscle is gained and fat mass stays similar. Scale weight alone cannot distinguish those paths.
Why category boundaries feel more precise than they are
Imagine a smart scale estimates 24.8% for a man. One chart labels 24% “average” and 25% “high.” The device’s likely error is much wider than the 0.2 percentage-point distance to the boundary. Treating the next decimal as a verdict gives the category more authority than the measurement deserves.
The same problem appears when a woman receives 31% from a tape equation and 35% from a DEXA scan. Those methods use different models and can disagree without either representing a sudden body change. The useful question is not which number feels better. It is whether future measurements use a consistent method and whether health or performance is moving in the intended direction.
Age bands create another boundary problem. A person does not acquire a new healthy range on their 40th birthday. Population charts describe broad patterns across groups. They cannot define the best percentage for one person.
Use categories as conversation starters. If a result is near a boundary, write it down as a baseline and resist the urge to retest until normal fluid and measurement variation have settled.
Body fat percentage by age
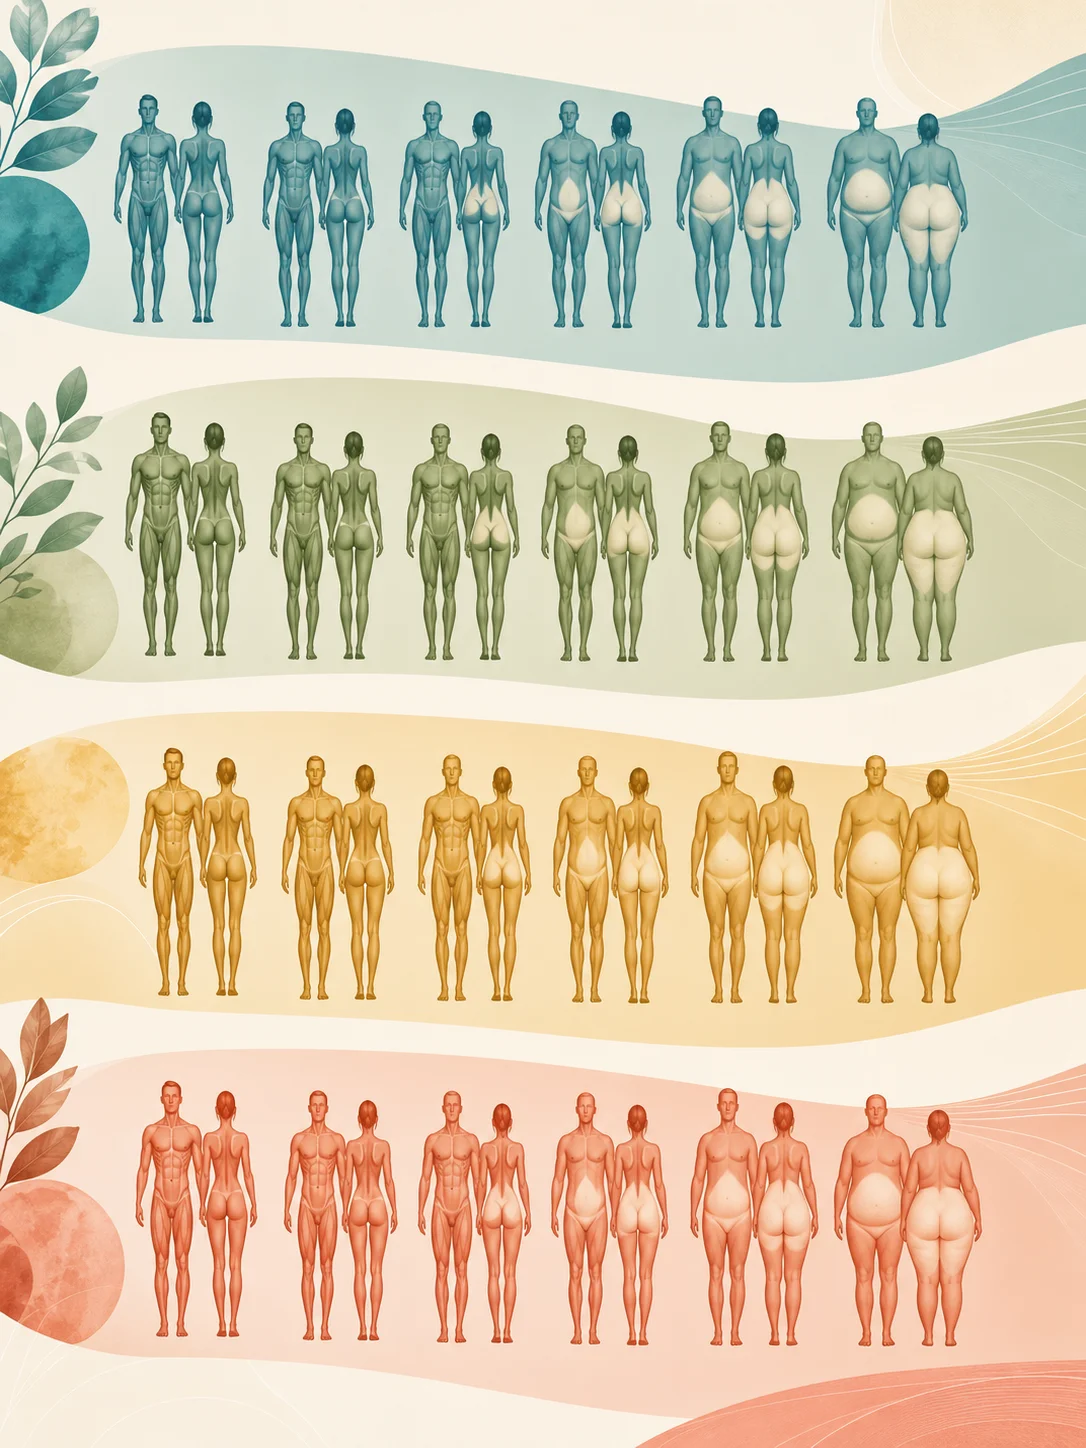
Across adulthood, body fat tends to creep up and muscle tends to shrink, mostly when resistance training and protein fall away. That isn’t inevitable. It is the reason age-aware charts nudge their bands upward in later decades.
These bands come from population research that related body fat to age, sex, and BMI (listed in the sources below):
| Age | Women | Men |
|---|---|---|
| 20-39 | About 21-32% | About 8-19% |
| 40-59 | About 23-33% | About 11-21% |
| 60-79 | About 24-35% | About 13-24% |
Nobody gets a new ideal range on a birthday. A man at 20% at 38 is in the same body at 40; the chart has just moved him to a different row. The bands also can’t tell a muscular athlete from someone who never trains, and healthy people sit above and below them.
For men, the useful goal later in life is often to trim abdominal fat while keeping muscle. A crash diet can make the percentage look better as strength drops. Waist size can also rise while the scale barely moves, and a home body-fat scale doesn’t measure the fat stored around organs.
For women, pregnancy, perimenopause, and menopause change where fat is stored, often toward the middle. Weight can stay flat while lean mass falls, which is why strength training, enough protein and total food, and sleep matter more here than chasing a lower number. Menopausal hormone therapy is prescribed for symptoms and wider health reasons, not as a body-fat treatment.
If you menstruate and use a smart scale, cycle-related fluid shifts can move the reading. Comparing readings from roughly the same point in your cycle cuts some of that noise. Pregnancy and the months after birth need their own interpretation, because standard consumer equations weren’t built for them.
How accurate is your measurement?
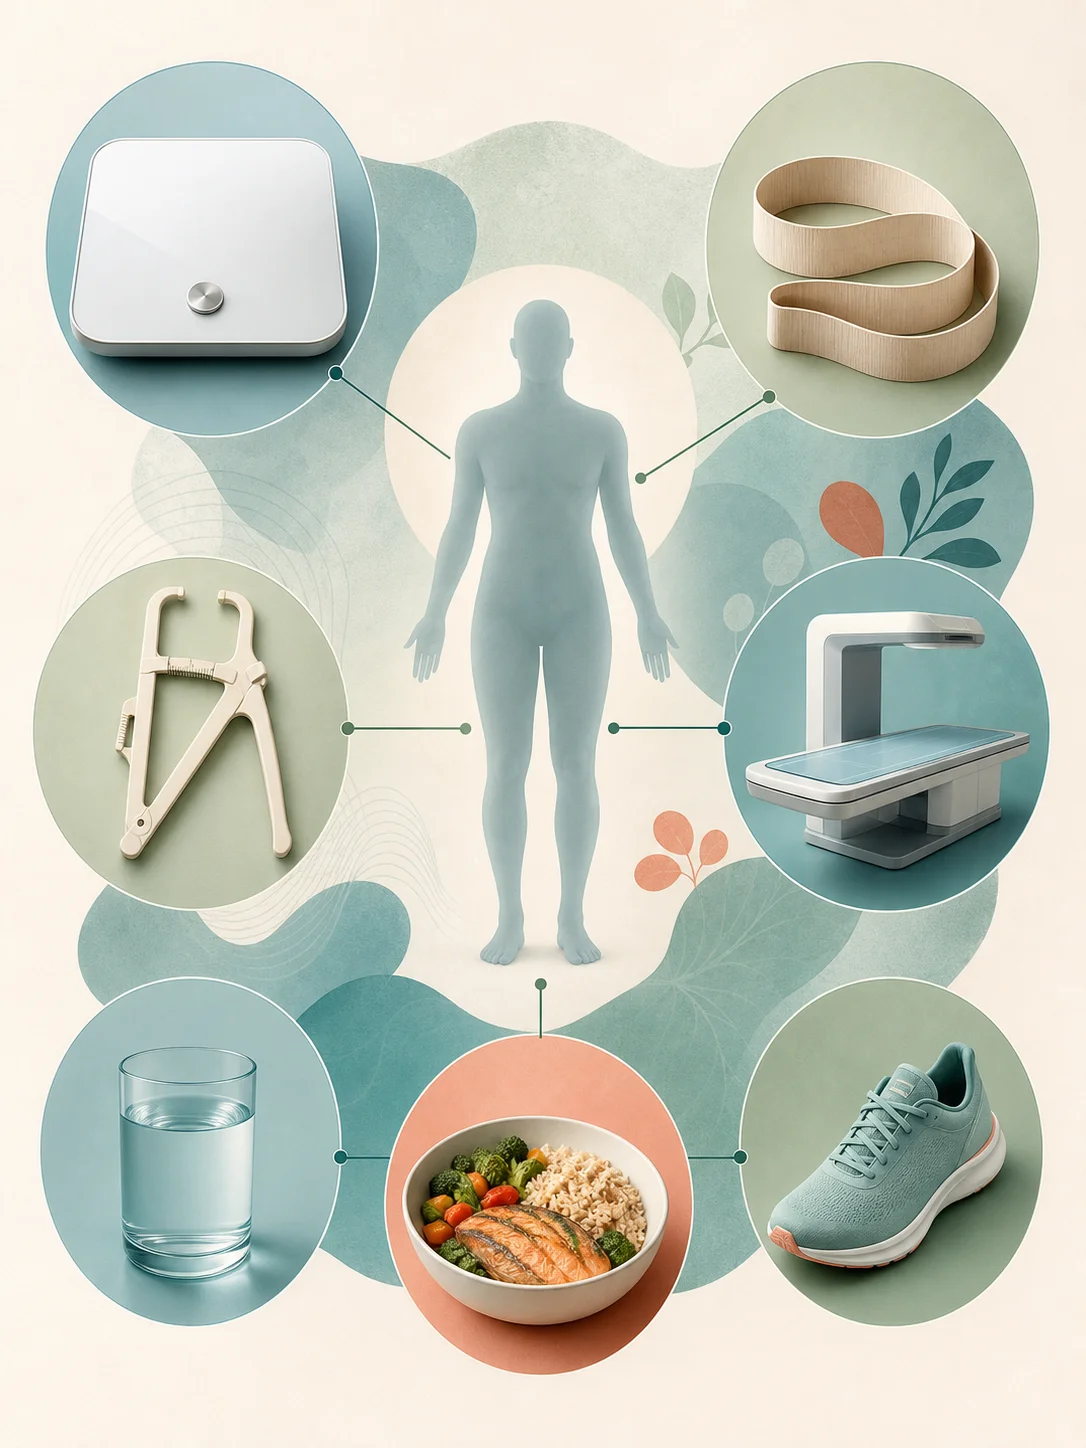
A smart scale sends a small electrical signal through the body and uses an algorithm to estimate composition. Hydration, food, exercise, skin temperature, foot contact, and the proprietary equation can change the result. Overnight shifts of several percentage points are too large to represent actual fat gain or loss.
Tape equations depend on accurate circumference landmarks. Skinfolds depend on tester skill. DEXA gives useful regional information but is not immune to protocol differences. Compare methods cautiously and track with the same method whenever possible.
How the main measurement methods differ
Bioelectrical impedance analysis, or BIA, estimates body water from electrical resistance and then uses an equation to infer fat-free mass and fat mass. Home foot-to-foot scales are convenient, but they measure a limited pathway and rely heavily on the device’s algorithm. Hand-to-foot systems may sample more of the body, yet hydration still matters.
The U.S. Navy tape method uses height and circumference measurements. It costs almost nothing and can work well for trends when the landmarks and tape tension are consistent. It becomes less reliable when body shape differs from the population used to create the equation.
Skinfold testing estimates subcutaneous fat at selected sites. A skilled tester can collect repeatable measurements, but the result depends on pinching the correct tissue, finding the same site, and choosing an appropriate equation.
DEXA uses low-dose X-rays to estimate bone mineral, lean tissue, and fat by region. It is detailed, not perfect. Machine model, software, positioning, recent food, and hydration can shift results. Air-displacement and underwater weighing have their own assumptions about body density.
No method lets you check the true result at home. Choose a method based on access, cost, repeatability, and the decision you are trying to make.
A repeatable home tracking protocol
For a smart scale, measure at roughly the same time of day, often after using the bathroom and before food or exercise. Keep the scale on the same hard surface. Bare feet should contact the electrodes in the same way. Do not compare a dehydrated post-workout reading with a well-hydrated morning reading.
For tape measurements, mark or carefully describe the anatomical landmark. Keep the tape horizontal and snug without compressing skin. Take two readings. If they differ more than expected, take a third and use the middle value rather than the one you prefer.
Measure every four to eight weeks if the goal is tissue change. Daily weight can be useful for some people because weekly averages smooth water fluctuation, but daily body-fat estimates usually create more noise than insight.
Record waist circumference, body weight trend, training performance, and one or two health goals beside the percentage. A log that says “waist down 3 cm, squat stronger, body-fat estimate unchanged” tells a fuller story than the percentage alone.
Stop tracking if the process triggers compulsive checking, food restriction, purging, or distress. A dietitian or mental-health professional can help choose measures that support health without feeding disordered behavior.
When a lower percentage is not better
Very low body fat can accompany low energy availability, meaning intake does not cover basic physiology and training demands. Warning signs can include persistent fatigue, poor recovery, irritability, frequent injuries, feeling cold, loss of menstrual periods, reduced libido, or declining performance.
Losing your period outside pregnancy, menopause, or a known medical cause isn’t a sign that a plan is working. Get it checked, even if the body-fat estimate doesn’t look especially low.
Athletic categories describe people who may be training for a sport. They are not a recommendation for the general public, and a competition-ready physique may be temporary. Maintaining the lowest possible percentage year-round can carry a cost that a chart does not show.
At the other end, a higher estimate does not diagnose disease. It can prompt a review of waist size, blood pressure, glucose, lipids, sleep apnea symptoms, mobility, and family history. The response should be proportionate and sustainable.
If body composition is changing without trying, particularly with weakness, appetite loss, swelling, or illness, seek medical advice. An unexplained shift may not be a fitness problem at all.
Choosing a useful goal
Start with the reason for measuring. Someone training for strength may care about adding muscle without a rapidly rising waist. Someone managing diabetes may care more about abdominal fat, activity, and glucose than reaching an athlete category. An older adult may put strength and independence first.
Set an action goal beside the body-composition goal. Examples include resistance training twice a week, eating a protein source at regular meals, walking after dinner, or improving sleep consistency. These actions can be adjusted when life changes.
Use a slow trend. Aggressive energy restriction increases the chance of losing lean mass and can make training, mood, and adherence worse. If weight loss is appropriate, pair a moderate deficit with resistance exercise and adequate nutrition. If muscle gain is the priority, use progressive training and enough energy rather than judging success from the scale alone.
Review the plan after several weeks, not after one reading. Keep what is working and change one variable at a time.
If you pay for a scan, decide beforehand what the result could change. A baseline before a long training phase can be useful. Repeating an expensive test every few weeks rarely adds clarity because expected tissue change may be smaller than method and hydration variation. Use the time between assessments to train, eat, sleep, and recover rather than hunting for a more flattering device.
What to pair with body fat percentage
Track waist or waist-to-hip ratio, strength, aerobic fitness, blood pressure, glucose, lipids, menstrual health when relevant, energy, sleep, and mobility. Our waist-to-hip chart explains how distribution adds a different kind of information.
Treat the number as an estimate
Use the chart to orient yourself, not to chase a boundary. A consistent trend plus real health and performance markers is more useful than a supposedly precise single percentage.
Evidence and review
How this article was checked
Category ranges and age context checked against ACE educational standards and population research. Categories are not diagnoses. Evidence last reviewed Aug 4, 2026.
- ACE - Percent Body Fat Calculator - Common descriptive body-fat categories for adults.
- PubMed - Healthy Percentage Body Fat Ranges - Population research relating body-fat percentage to age, sex, and BMI.
- PubMed - Wearable Body Composition Validity - Current evidence on validity and consistency of wearable and BIA estimates.
FAQ
Frequently asked
Answers
Frequently asked questions
What body fat percentage is considered healthy?
There is no single healthy percentage for every adult. Sex, age, muscle mass, health markers, menstrual function, and measurement method all matter.
Is DEXA perfectly accurate?
No method is perfect. DEXA is useful and detailed, but machine calibration, software, hydration, and protocol can still affect results.
What is a healthy body fat percentage by age?
Population research puts many adults aged 20 to 39 at roughly 21-32% for women and 8-19% for men, with the bands drifting a few points higher by the 60s and 70s. These are descriptive ranges, not personal targets.
How often should I measure body fat?
Because estimates are noisy, measuring under consistent conditions every four to eight weeks is usually more meaningful than reacting daily.
Share this article


