Healthy body fat percentage for men by age
Sheenam Midha · Health writer

On this page
Healthy body fat percentage for men by age is a broad reference, not a universal goal. The number should be interpreted with waist size, muscle mass, strength, fitness, laboratory markers, and the uncertainty of the measuring method.
Use the body-fat-percentage calculator for a tape-based estimate.
Why men’s body fat ranges change with age
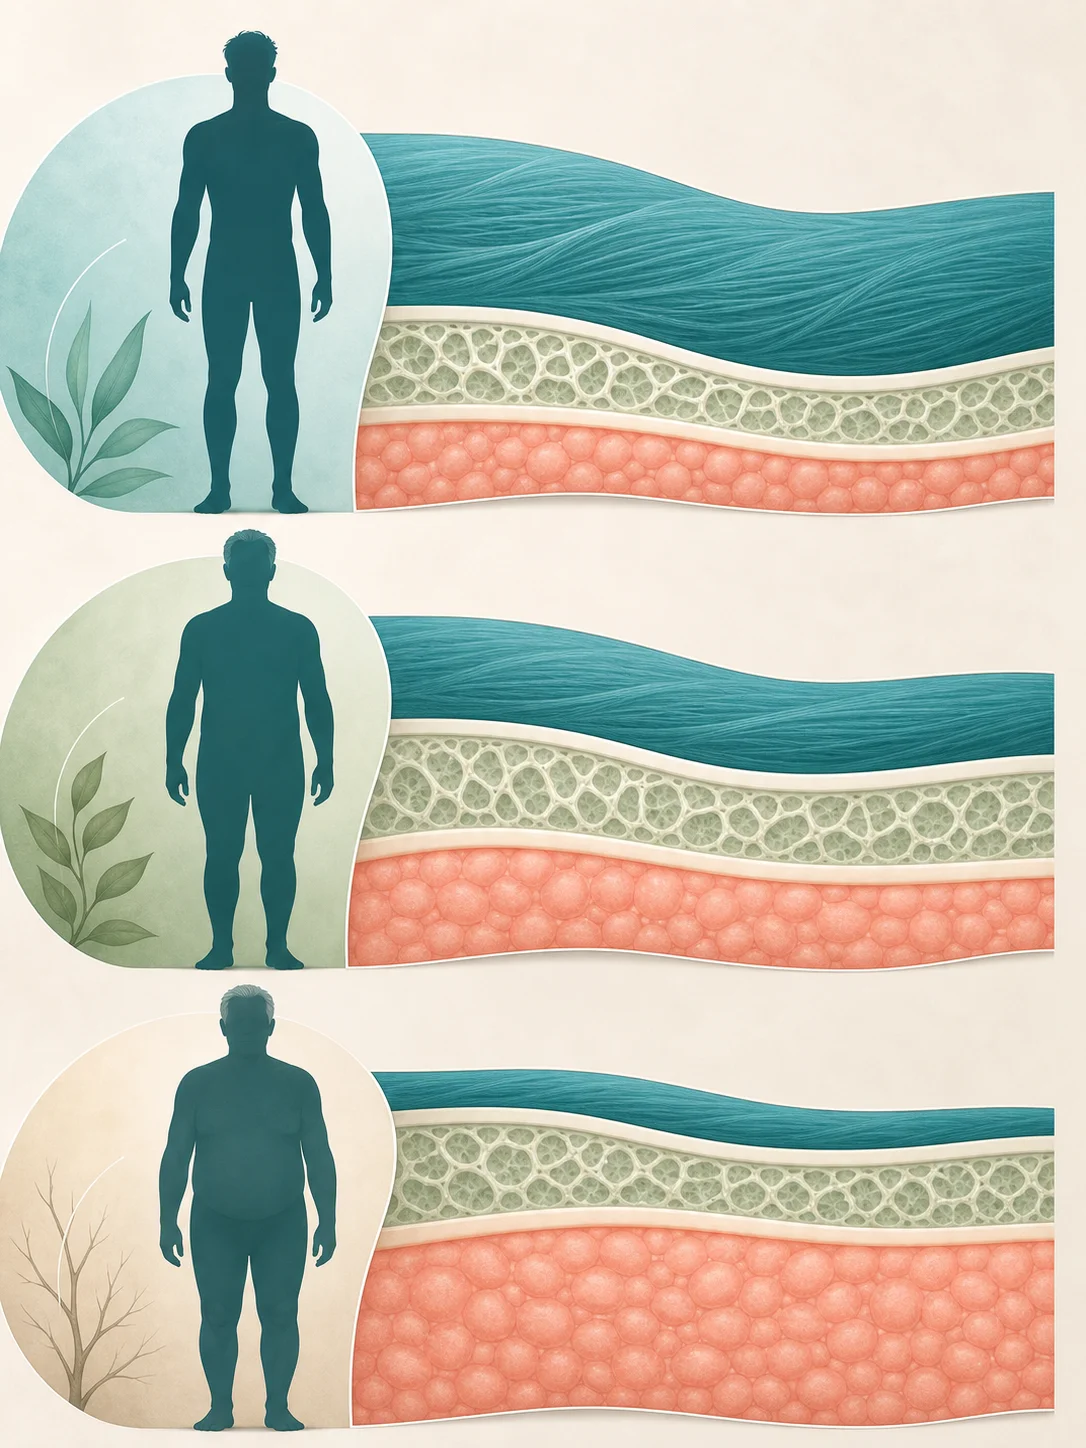
Without resistance training and adequate protein, lean mass commonly declines across adulthood while fat mass and waist size rise. That pattern is not inevitable, but it explains why age-aware reference bands differ.
Extremely low body fat is not automatically optimal. Energy deficiency can affect testosterone, bone, mood, immunity, and recovery.
Healthy body fat percentage for men by age chart
Commonly cited population bands derived from age- and sex-aware body-composition research are:
| Age | Commonly cited healthy reference band |
|---|---|
| 20-39 | About 8-19% |
| 40-59 | About 11-21% |
| 60-79 | About 13-24% |
These bands do not distinguish a muscular athlete from a sedentary person and do not set a treatment threshold.
How the number is estimated
Tape methods use waist and neck measurements with height. Bioimpedance scales estimate composition from electrical resistance. Skinfolds depend on technician skill. DEXA estimates fat, lean tissue, and bone regionally.
Each method has error. Do not switch among devices and interpret the change as physiology. If a home scale reads 18% and a DEXA reads 23%, the difference may reflect method rather than sudden change.
What matters beyond body fat percentage
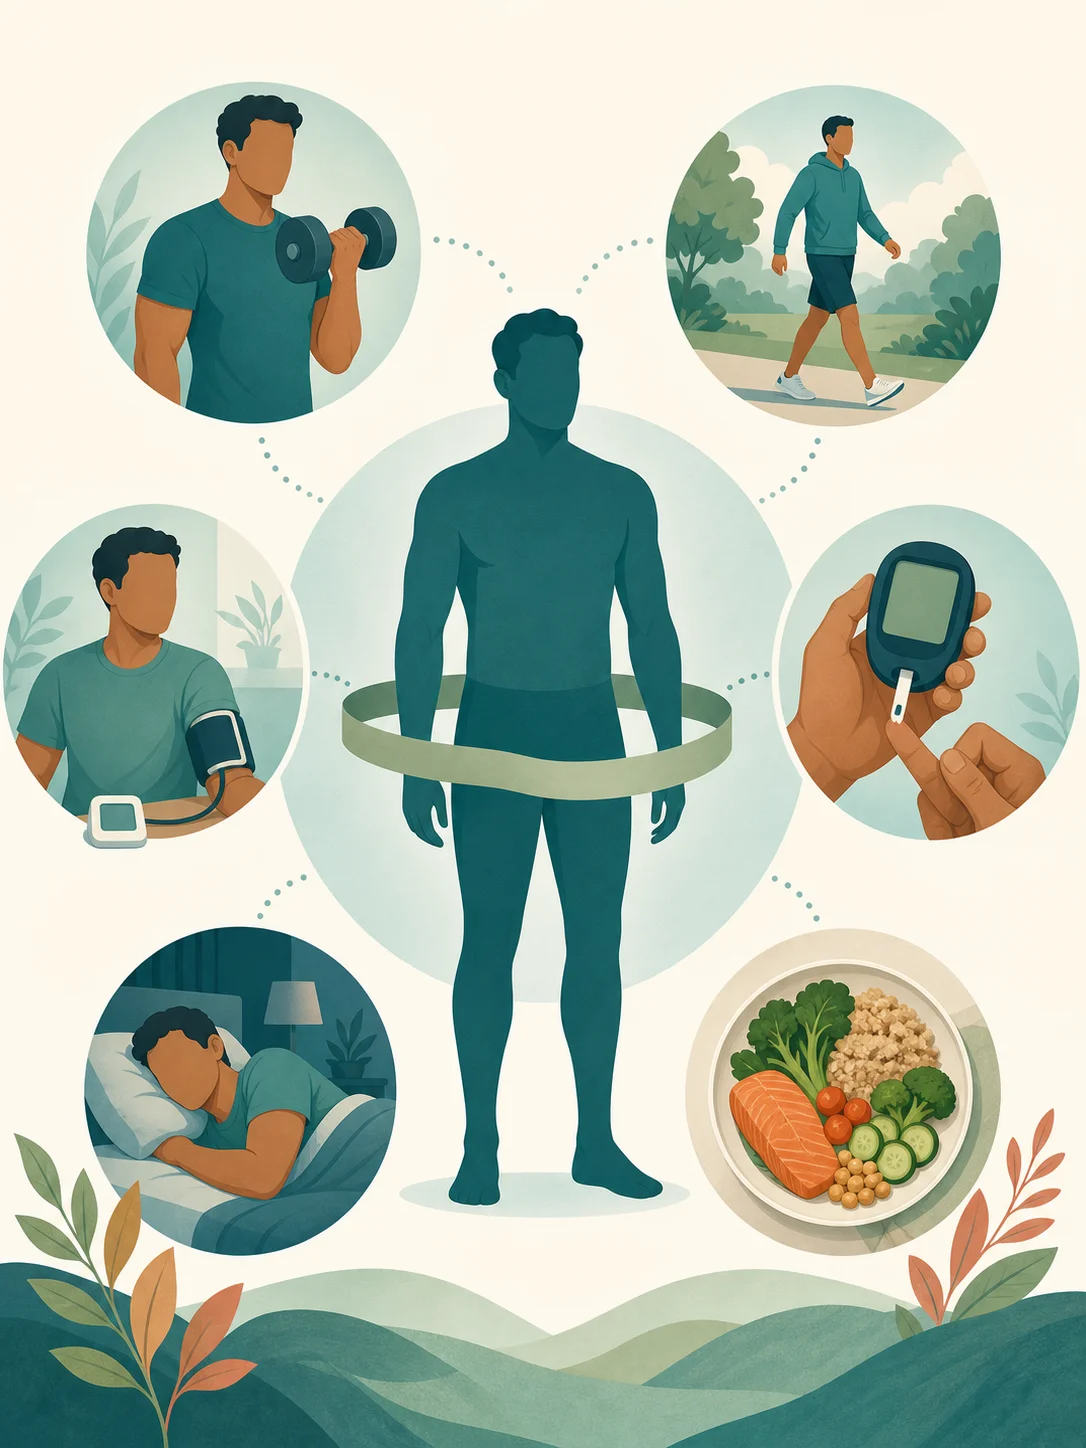
Waist and fat distribution influence cardiometabolic risk. Use the waist-to-hip calculator and our measurement guide for another lens.
Also review blood pressure, lipids, glucose, sleep, smoking, aerobic fitness, strength, and family history. A man at 24% with strong fitness and healthy markers may have a different risk profile from someone at the same percentage with a rapidly rising waist and abnormal labs.
How to improve body composition safely
Use gradual energy change, progressive resistance training, adequate sleep, and enough protein. The protein-intake guide gives evidence-based ranges, while the full body-fat chart compares broad categories for men and women.
Measure under consistent conditions every few weeks. Daily body-fat readings add noise without revealing useful tissue change.
The bottom line
The age chart gives context, but your trend and health picture matter more than landing on one exact percentage.
Evidence and review
How this article was checked
Age bands checked against population research and common body-composition categories. The article avoids treating a range as a diagnosis. Evidence last reviewed Aug 3, 2026.
- PubMed - Healthy Percentage Body Fat Ranges - Population research relating body fat percentage to age, sex, and BMI.
- ACE - Percent Body Fat Calculator - Common body-fat categories and estimation context.
- PubMed - Wearable Body Composition Validity - Evidence on strengths and limits of BIA-based body-composition estimates.
FAQ
Frequently asked
Answers
Frequently asked questions
What is a healthy body fat percentage for men?
Common references place many adult men roughly from the high single digits into the mid-20s depending on age and context. One percentage cannot define health.
Is very low body fat healthy for men?
Not necessarily. Very low levels can impair hormones, mood, immunity, training recovery, and energy availability, especially when maintained through severe restriction.
Why did my smart scale change overnight?
Hydration, food, exercise, temperature, and algorithmic variability can shift bioimpedance estimates. Actual fat tissue does not usually change by several percentage points overnight.
Share this article