Healthy body fat percentage for women by age
Sheenam Midha · Health writer

On this page
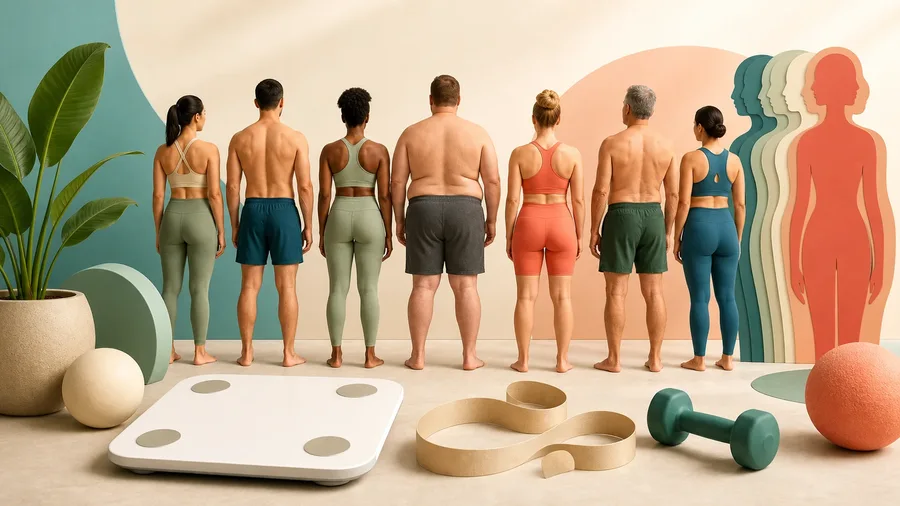
Healthy body fat percentage for women by age is best understood as a broad population range, not a pass-or-fail target. Age, menopause, muscle mass, ethnicity, health history, and the measurement method all change what one number means.
Use the body-fat-percentage calculator for a tape-measure estimate, then treat the result as one data point.
Why women’s body fat ranges differ
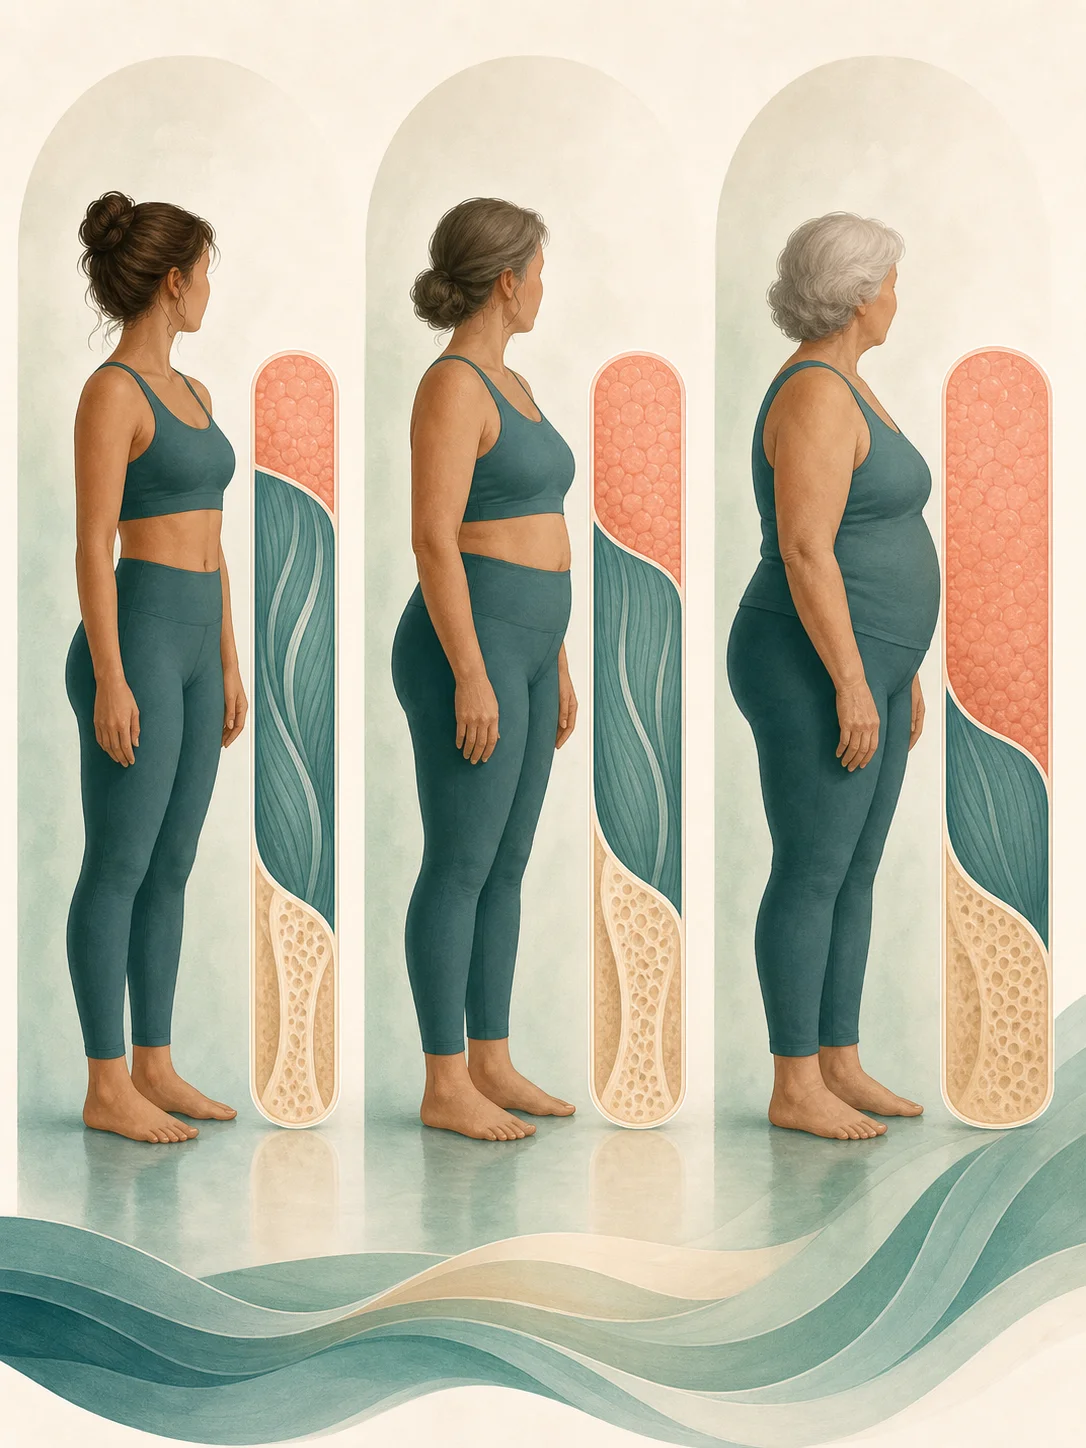
Women generally carry more essential and reproductive fat than men. Body-fat distribution also changes across adulthood, particularly through pregnancy, perimenopause, and menopause. A stable weight can hide a shift from lean mass toward fat mass, while resistance training can improve composition without dramatic weight loss.
Very low body fat is not automatically healthier. Menstrual disruption, low energy availability, impaired recovery, and bone loss are important concerns in active women.
Healthy body fat percentage for women by age chart
The following commonly cited bands are adapted from population research that related body fat to age, sex, and BMI. They are descriptive reference ranges, not treatment goals.
| Age | Commonly cited healthy reference band |
|---|---|
| 20-39 | About 21-32% |
| 40-59 | About 23-33% |
| 60-79 | About 24-35% |
Athletes may sit below these bands, and healthy individuals can sit above or below them. A clinician may care more about waist size, blood pressure, glucose, lipids, strength, mobility, and weight trajectory.
How body fat is measured
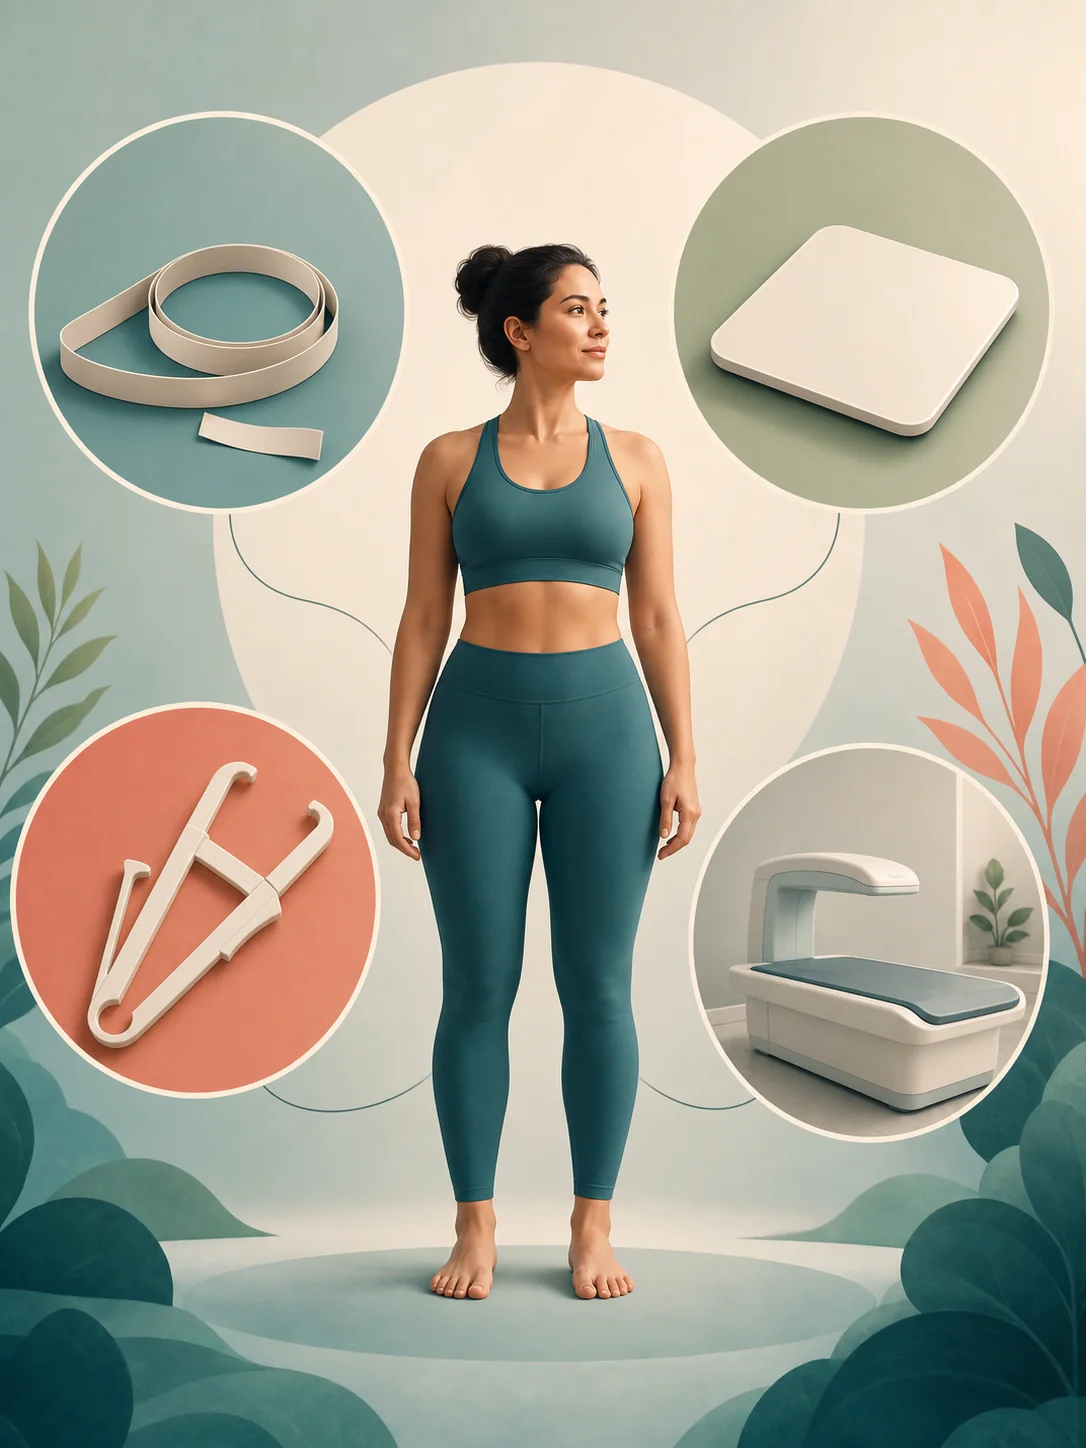
- Tape-measure equations: inexpensive and repeatable, but sensitive to landmark and tape placement.
- Skinfold calipers: useful with a skilled tester and consistent sites.
- Bioelectrical impedance: convenient but affected by hydration, meals, exercise, temperature, and algorithm.
- DEXA: provides regional composition and bone information but still has machine and protocol variation.
Recent Reddit discussions about smart scales repeatedly ask whether the body-fat number is “real” after overnight jumps. The practical answer is to standardize conditions and follow the trend, not interpret a one-day change as new fat tissue.
How menopause changes the context
Hormonal changes can promote more central fat storage and make muscle preservation more important. Protein intake, progressive resistance training, sleep, and adequate total energy support strength and bone health. A smaller waist is not the only goal; maintaining function matters.
See the body-fat chart for men and women for measurement categories and the waist-to-hip ratio guide for fat distribution.
How to track change without being misled
Measure at the same time of day, under similar hydration and meal conditions, with the same device and protocol. Compare four-to-eight-week trends. Pair the percentage with waist measurement, progress photos if helpful, strength, clothing fit, and laboratory markers.
For male reference bands, use our men’s body-fat-by-age guide rather than applying women’s ranges.
The bottom line
A body-fat estimate is useful when it supports a broader health picture. It becomes harmful when small device fluctuations are treated as precise biological truth.
Evidence and review
How this article was checked
Age bands checked against population body-composition research and measurement limitations. Ranges are descriptive, not diagnostic targets. Evidence last reviewed Aug 3, 2026.
- PubMed - Healthy Percentage Body Fat Ranges - Population research relating body fat percentage to age, sex, and BMI.
- ACE - Percent Body Fat Calculator - Common descriptive body-fat categories and calculator methodology.
- PubMed - Wearable Body Composition Validity - Evidence that consumer BIA body-composition estimates show mixed validity.
FAQ
Frequently asked
Answers
Frequently asked questions
What is a healthy body fat percentage for women?
Common charts place many adult women in ranges from the low 20s into the mid-30s depending on age, but health cannot be defined by one percentage.
Why is women's essential fat higher than men's?
Female reproductive and hormonal physiology requires more essential fat. Extremely low levels can disrupt menstruation, bone health, fertility, and recovery.
Are smart-scale body-fat readings accurate?
They can be useful for trends under consistent conditions but may differ substantially from DEXA and shift with hydration, food, exercise, and device algorithms.
Share this article